In recent years, the ever-growing need for theoretical and empirical risk indicators has driven a rapid expansion of research on price volatility in financial markets. Financial market volatility is a quantity that is difficult to observe. Although it can be observed by watching instrument prices and their movement on a monitor, people cannot directly "watch" volatility. Volatility must be approximated using calculations that draw on such observable values as daily price changes or intraday price changes, and these volatility calculation techniques fall into roughly two categories: parametric methods and nonparametric methods.
Absolute return volatility and realized volatility have been the two most popular nonparametric measurements in quantitative assessment of risk over the past decade. Economists and data analysts have been using these two measurements in quantifying risk, but never systematically made comparison and differentiation between them.
Aiming at this problem, Zheng Zeyu, researcher from Shenyang Institute of Automation (SIA), the Chinese Academy of Sciences (CAS) and Professor H.E. Stanley from Boston University, as well as Professor Li Baowen from National University of Singapore jointly conducted research and for the first time compare the absolute return volatility and realized volatility—and focus on their accuracy as risk indicators, their short-term effect, and their long-term memory.
The researchers compare the two in details and find that although realized volatility has a better short-term effect that allows predictions of near-future market behavior, absolute return volatility is easier to calculate and, as a risk indicator, has approximately the same sensitivity as realized volatility. Detailed empirical analysis yields valuable guidelines for both researchers and market participants because it provides a significantly clearer comparison of the strengths and weaknesses of the two methods.
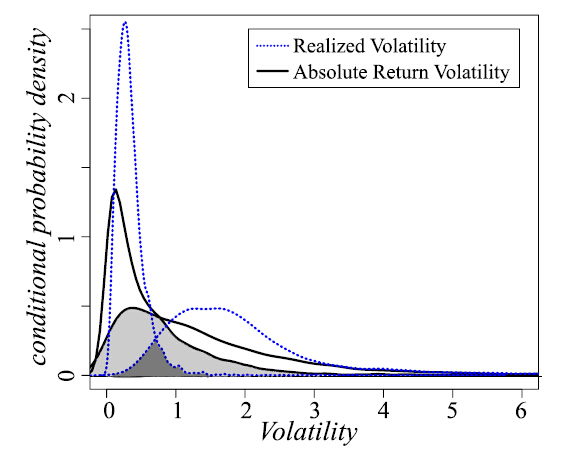
The conditional probability density for the largest and smallest 1/6th portion of the absolute return volatility (black line)and realized volatility (blue dots). The cross-over area (gray area) of absolute return volatility is much larger than the cross-over area (dark gray area) of realized volatility. Noted that we had normalized the variance of both values to 1, the results may mostly reflect that the neighboring days’memory of RV and AV are significantly different.(Image provided by ZHENG Zeyu et.al)
The work, entitled as Realized Volatility and Absolute Return Volatility: A Comparison Indicating Market Risk, was published on the PLOS ONE. 2014 9(7):e102940.
Contact:
Zheng Zeyu
Shenyang Institute of Automation, Chinese Academy of Sciences
zhengzeyu@sia.cn