|
|
| Data visualization and classification method discovered for early detection of liver disease |
| Author: |
|
Update times: |
2014-04-10 |
|
| Print | Close | Text Size: A A A |
|
|
Liver disease is one of the most common diseases. Liver cancer is the fifth most commonly diagnosed cancer in men and the seventh in women. According to Department of Health statistics, liver disease has consistently been among the top 10 fatal diseases in Beijing. In 2010, liver cancer accounted for 11.3% of cancer mortality in men and is second only to lung cancer. Symptoms are easily overlooked in the initial stage, and by the time they appear, the patient has missed the best opportunity for treatment. Effective early diagnosis is therefore of paramount importance, the automation of this diagnosis is highly desirable. Recently, researchers from Shenyang Institute of Automation (SIA), the Chinese Academy of Sciences (CAS) proposed a data visualization and classification method for early detection of liver disease. By combining support vector data description (SVDD) with data visualisation techniques and the glowworm swarm optimisation (GSO) algorithm, they improve diagnostic accuracy. Experimental results show that the proposed method can achieve 96% sensitivity, 86.28% specificity, and 84.28% accuracy. The new method is thus well-suited for diagnosing early liver disease. The basic procedure of the proposed method is shown in Fig 1. There are three steps: (1) Feature selection. (2) Data visualisation. (3) GSO algorithm and SVDD. The researchers investigate 225 liver function test records (each record include 14 features), which is a subset from 1000 patients’ liver function test records that include the records of 25 patients with liver disease from a community hospital. A 2-D visualisation is first constructed as shown in Fig. 2, where circles of different colours denote different classes. 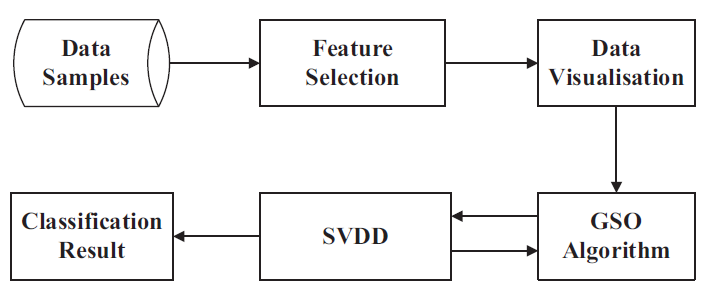
Fig 1. Flowchart of the method procedure. (Image provided by ZHOU Xiaofeng et,al.) 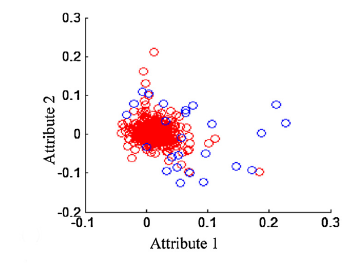
Fig. 2. Comparison of the liver disease 2-D visualisation of ICA. Blue circles indicate abnormal samples and red circles indicate normal samples. In each graph, two axes represent the 2 nondimensional components of these four dimensionality reduction methods. (Image provided by ZHOU Xiaofeng et,al.) In this study, the researchers use 20 glowworms. And in each step of iteration, the best glowworm which gets maximum sum value of accuracy, sensitivity and specificity will be selected as the next step’s input value. Fig. 3 shows the sensitivity from the SVDD model as a function of q C based on the 2-D visualisation. Topographic maps of the 2-D visualisation for four glowworms whose decision function values are 2.6724, 2.6561, 2.6695 and 1.9943 are shown in Fig. 4.
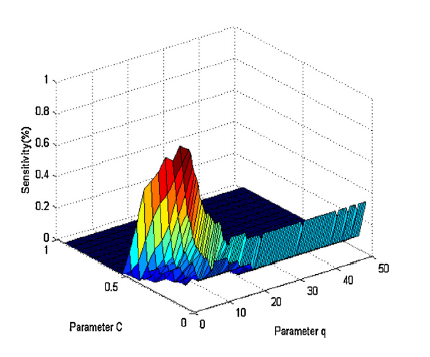
Fig. 3. Sensitivity of SVDD models with different values of parameter q and C. (Image provided by ZHOU Xiaofeng et,al.) 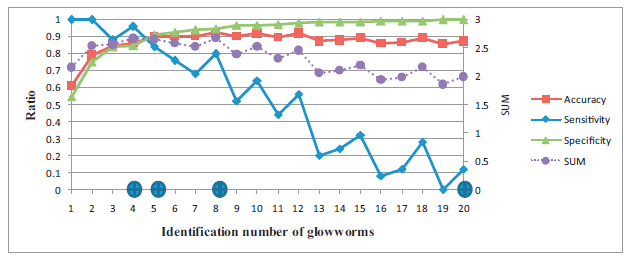
Fig. 4. The accuracy, sensitivity, specificity and sum for a representative population based on 2-D visualisation in the GSO algorithm. (Image provided by ZHOU Xiaofeng et,al.) In general, the sensitivity is a very important medical criterion. For this reason, glowworm 5, with q=8.7246 and C=0.0526, was taken to be optimal. Glowworm 5 provides with the highest sensitivity of 96%, accuracy of 86.28%, and specificity of 84.67%. The three criteria are now optimally balanced in Fig. 5. 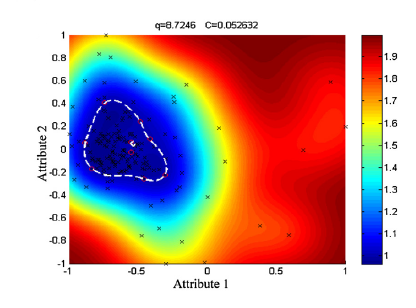
Fig. 5. Topographic map for a 2-D visualisation, mapped back on the input space. The dashed white curve shows the surface of the hypersphere. (Image provided by ZHOU Xiaofeng et,al.)
This work was published on Biomedical Signal Processing and Control 11(2014)27–35. It was supported by the Natural Science Foundation of Beijing (Grant No. 7110001). CONTACT: ZHOU Xiaofeng Shenyang Institute of Automation Chinese Academy of Sciences |
|
|
|