Redundancy techniques like duplication and triple modular redundancy are widely used to design fault tolerant systems which have demanding safety or reliability requirements. The proper operation of all redundant systems is clearly dependent on the system's ability to detect, isolate and correctly accommodate failures of the redundant elements, a system function called redundancy management (RM). Automatic diagnosis (AD) mechanisms are classical online RM techniques. As shown in Fig. 1, all AD mechanisms have to introduce some form of redundancy. Since redundant systems are subject to common cause failure (CCF) the performance of AD mechanisms will be affected by CCF. Further, diversity has long been identified as an effective antidote for CCF, it is expected that the performance of AD can be improved when diversity is introduced. Therefore it is desirable to assess the effect of CCF and diversity on DC of different AD schemes in course of reliability assessment of redundant systems.
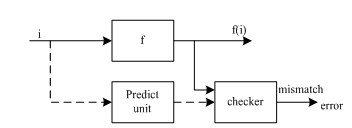
Fig. 1. The principle of Automatic Diagnosis technique.(Image provided by WANG Kai,et.al)
Therefore, researchers from Shenyang Institute of Automation (SIA), the Chinese Academy of Sciences (CAS) proposed a novel method is proposed to quantitatively compare two different AD schemes which include identical redundancy and diverse redundancy based on the protection (data integrity) they provide against CCF. The AD schemes considered are implemented in the form of self-checking pairs.
As shown in Fig. 2, the method is composed of the following three phases.
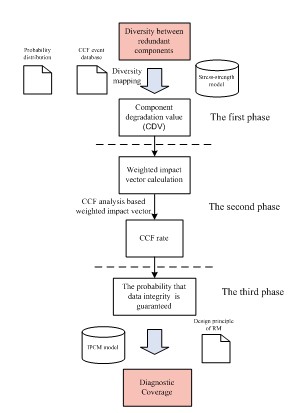
Fig. 2. A novel method to quantify the effect of CCF and diversity on DC. (Image provided by WANG Kai,et.al)
(1) Diversity mapping.
The rationale for diversity is that different designs will have different failure modes and will not be susceptible to the same common influences. Thus in this context the effect of diversity on system performance can be understood that it is intended to decrease the component degradation values (CDVs) of the redundant components. Therefore, CDV is used to quantify the effect of diversity.
(2) CCF rate calculation.
After the CDV value of each component in the CCCG is calculated, the weighted impact vector can be calculated according to Table 1. Note that for each IF category one weighted impact vector exists. Then the number of events can be calculated as equation (1).
 (1)
(1)
Where,
nk : total number of Basic Events involving failure of k similar components;
m: number of the IF Categories considered in CCF analysis;
wi : weight of the IF Category i, which can be determined according to the reliability database;
Fk(i): the k th element of the weighted impact vector for IF category i.
The parametric Alpha Factor model was chosen whose parameters can be estimated using the following maximum likelihood estimators:
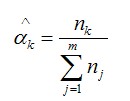 (2)
(2)
Where,
nk : total number of Basic Events involving failure of k similar components;
m: the size of the CCCG;
 : the kth parameter of the Alpha Factor model.
Table 1. Calculation of weighted impact vector based on CDV values.
|
F0 |
F1 |
F2 |
|
(1-CDV1)(1-CDV2) |
CDV1(1-CDV2) +
CDV2(1-CDV1) |
CDV1CDV2 |
(3) DC calculation.
After the CCF rate is determined, DC can be calculated based on the RM design principle applied in the system. As far as the self-checking pair system is concerned the DC can be calculated as follows.
DC= (1- Pccf - Pind) * Pc (3)
As shown in Fig.3, the researchers used a two-channel redundant system in which each redundant element employs a self-checking pair as an illustration case. To assess the DC of self-checking pair considering both CCF and diversity factor, two cases are considered as follows. Case (1): A1 and A2 are identical. Case (2): A1 and A2 are different. Assume further that the component types of both of A1 and A2 are electrical controller. Due to the example is intended to illustrate the method proposed, related parameters of redundant elements are assumed according to related component reliability data base in course of reliability assessment.
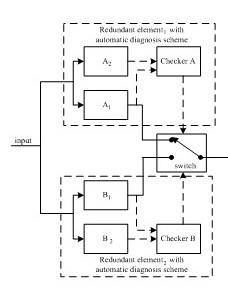
Fig. 3. A system with duplex redundant units.(Image provided by WANG Kai,et.al)
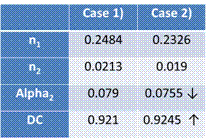
The results are shown in Table 2, which confirm that the diversity technique increases the DC of the self-checking pair. Further, for the first time, the relationship among diversity, CCF rate and DC is quantified by the proposed method.
Table 2 Alpha factor and diagnostic coverage calculation
This work was presented on the 2013 IEEE International Conference on Electronic Measurement & Instruments (IEEE ICEMI) in August 2013. IEEE ICEMI is the world’s premier conference, and is convened every two years. It dedicated to the electronic test of devices, boards and systems --- covering the complete cycle from design, verification, test, diagnosis, failure analysis and back t process and design improvement. The purpose of the ICEMI is to provide excellent opportunities for scientists, engineers and participants throughout the world to present latest research results and to exchange their views or experiences. The 11th IEEE ICEMI was held during 16th to 19th August, 2013, in Harbin, China. This work was supported by the National Natural Science Foundation of China (61004068).
CONTACT:
Dr. Kai Wang
Shenyang Institute of Automation, Chinese Academy of Sciences
E-mail: wangkai@sia.cn